 By MICHAEL FRANCIS
We have a coming election for House here in District 43.
I was interested in seeing what the distribution of donors was, to see what money was trying to influence our race, and what the breakdown is between the Democratic (Dem.) candidate Christine Chandler and the Republican (Rep.) candidate Lisa Shin.
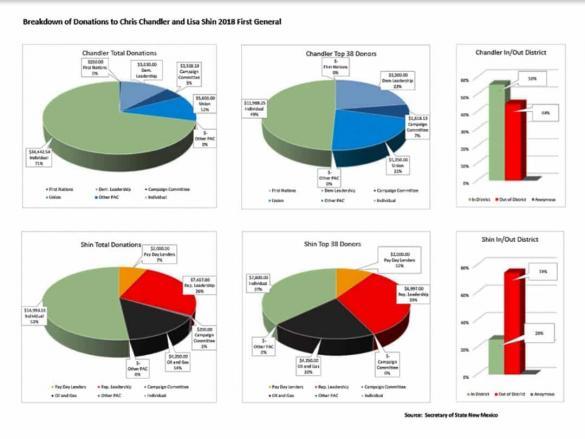
The result is here, which is a distributional measurement of the data taken from the Secretary of State donation report. The distributional measurements shows the donations in amount, and source. The breakdowns are shown in pie graph and histogram form, telling a story of their own.
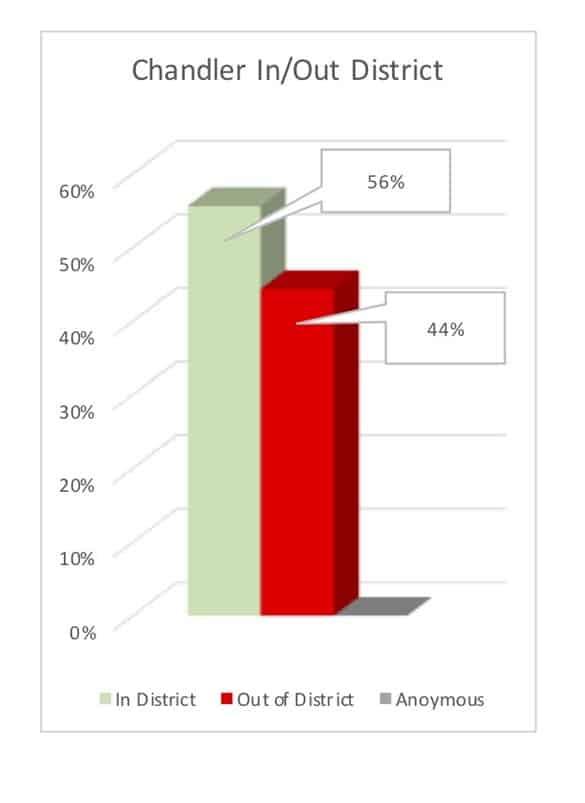
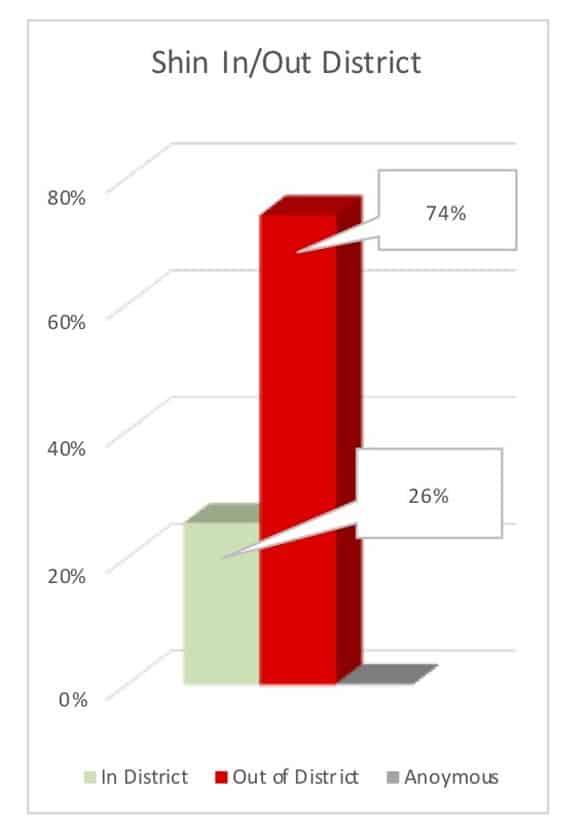
The Secretary of State data set shows 74 percent of Rep. money is coming from out of district, and 44 percent of Dem., – a lot of outside money is trying to influence our district.
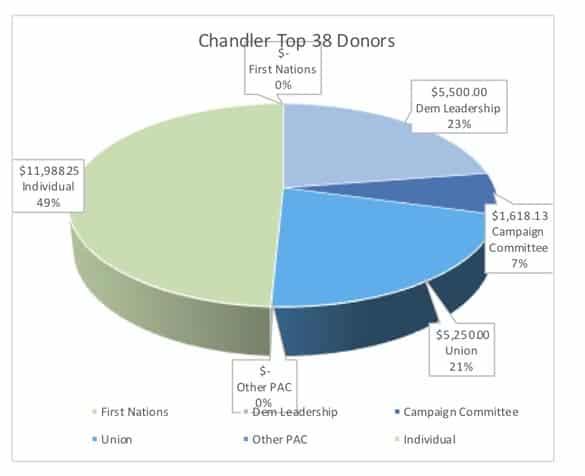
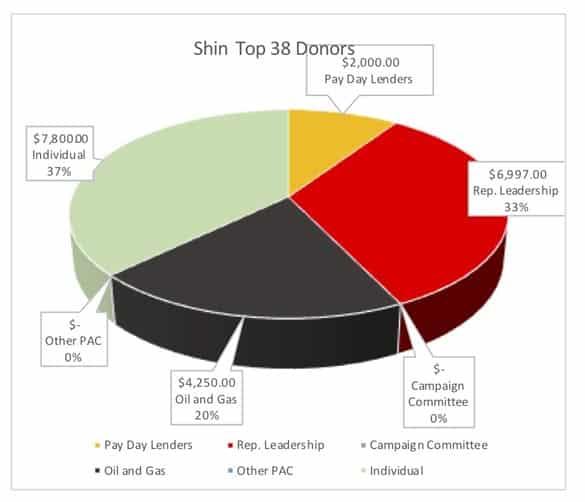
Within the list of donors, the Secretary of State data allows the distribution to be viewed by source, and by size, allowing the identification of the overall donors and the those who donated the most (top 38).
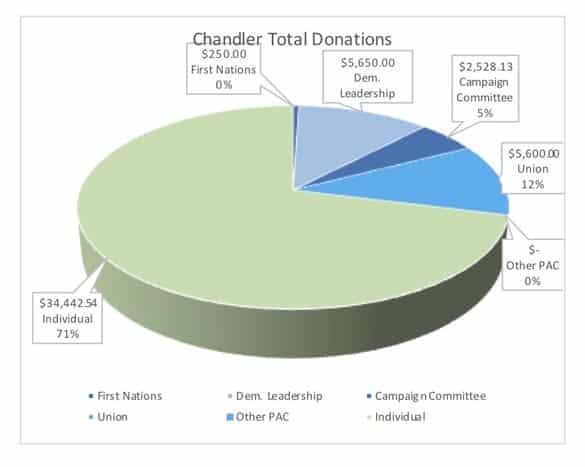
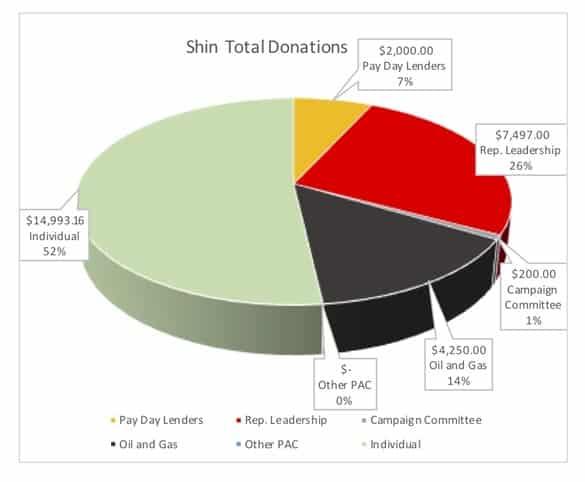
Both Rep. and Dem. donors show percentages from individuals, their parties and their campaigns; 7 percent of Rep. money comes from pay day lenders, and 14 percent from oil and gas; on the Dem. side 12 percent of Dem. money comes from unions; these special interest only grow when we look at the largest donors, both on the Rep. and Dem. side.
The data set does not allow us to know what the individual donors had in mind, but the institutional donors had to identify themselves, and this gives us a story of the money in the race.
We have a lot of outside money in our district, from both pay day lenders and oil and gas going to Republicans, and from Unions going to the Democrats.
No matter what our beliefs, we all should know who is trying to influence us, and keep this in mind as we form our opinions.