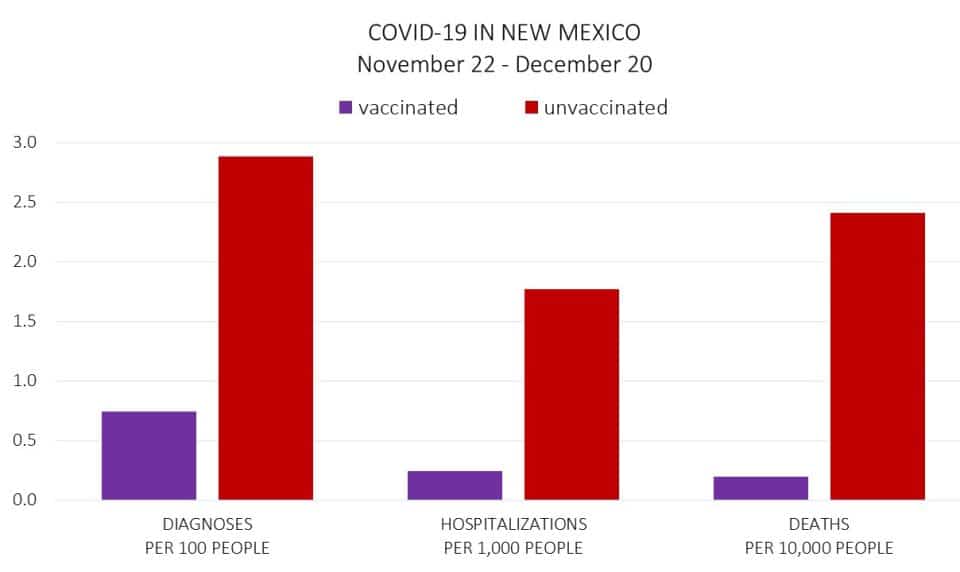
 The bars in this chart display the diagnoses rate, the hospitalization rate, and the death rate by vaccination status. These rates were calculated using the statewide totals for the four week period ending Dec. 20, 2021. Source: New Mexico Department of Health. Created by Eli Ben-Naim

Menu
Chart: 552: COVID-19 Update New Mexico Dec. 22

Copyright © 2012-2024 The Los Alamos Daily Post is the Official Newspaper of Record in Los Alamos County. This Site and all information contained here including, but not limited to news stories, photographs, videos, charts, graphs and graphics is the property of the Los Alamos Daily Post, unless otherwise noted. Permission to reprint in whole or in part is hereby granted, provided that the Los Alamos Daily Post and author/photographer are properly cited. Opinions expressed by readers, columnists and other contributors do not necessarily reflect the views of the Los Alamos Daily Post. The Los Alamos Daily Post newspaper was founded Feb. 7, 2012 by Owner/Publisher Carol A. Clark.