
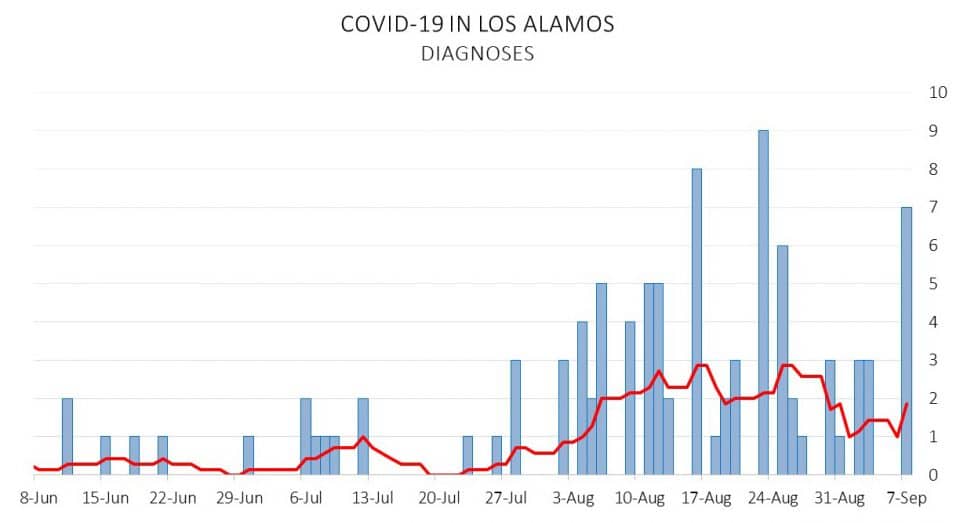
 The bars in this chart show the number of COVID-19 diagnoses in Los Alamos versus date, and the line shows the seven-day average. Source: New Mexico Department of Health. Created by Eli Ben-Naim
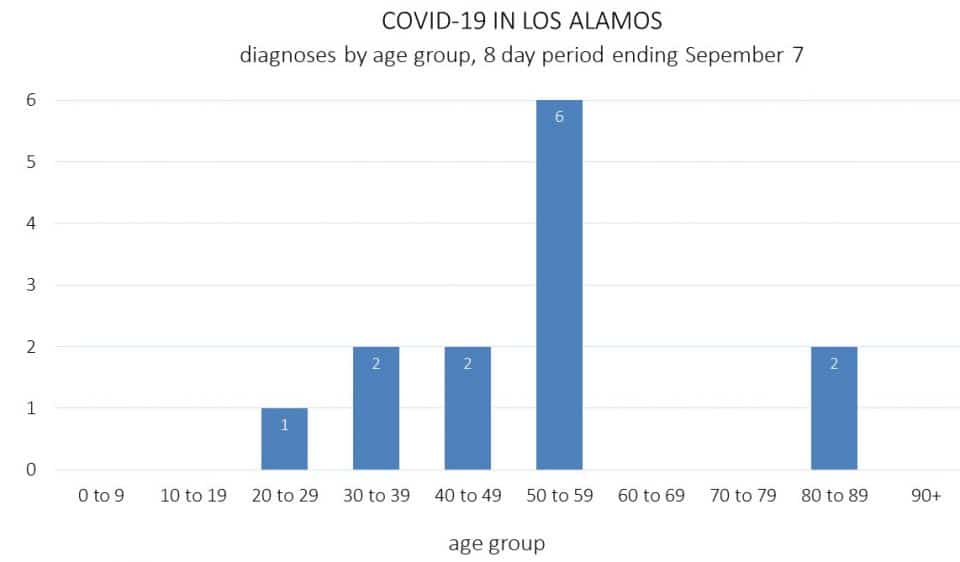 The bars in this chart show the number of COVID-19 diagnoses in Los Alamos by age group for the eight-day period ending Sept. 7. Source: New Mexico Department of Health. Created by Eli Ben-Naim