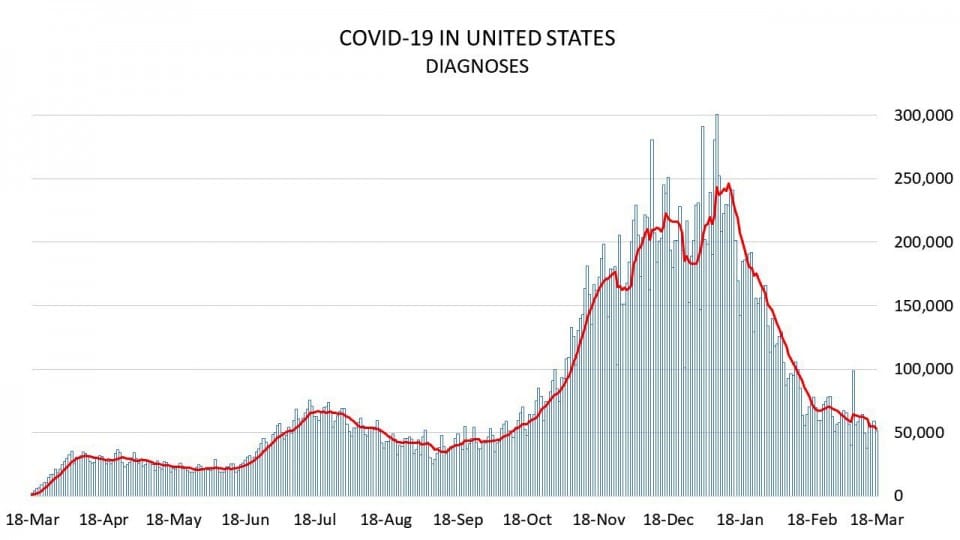
 The bars in this chart show the number of COVID-19 diagnoses in the United States versus date, and the line shows the seven-day average. Source: New York Times. Created Eli Ben-Naim
 The bars in this chart show the number of COVID-19 diagnoses in the United States versus date, and the line shows the seven-day average. Source: New York Times. Created Eli Ben-Naim