 Change in number of diagnoses during a two week period by county. The percentages indicate change in number of diagnoses between July 2 and July 15 compared with the period starting June 18 and ending July 1. Counties with less than 50 diagnoses are not shown. The statewide change is highlighted. Source: New Mexico Department of Health. Photo by Eli Ben-Naim
 Change in number of diagnoses during a two week period by county. The percentages indicate change in number of diagnoses between July 2 and July 15 compared with the period starting June 18 and ending July 1. Counties with less than 50 diagnoses are not shown. The statewide change is highlighted. Source: New Mexico Department of Health. Photo by Eli Ben-Naim
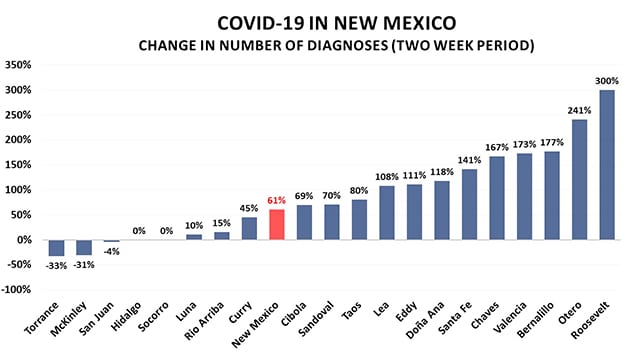