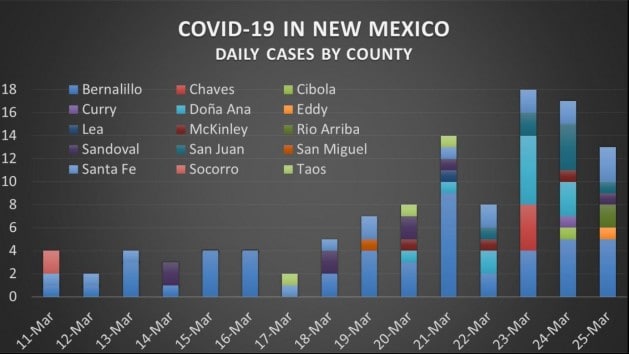
Chart shows between March 11 and March 25 the daily cases of COVID-19 by county in New Mexico. Courtesy/Eli Ben-Naim
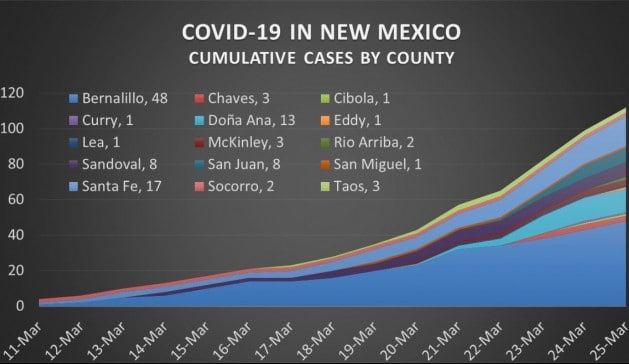
Chart shows the cumulative cases of COVID-19 by county in New Mexico. Courtesy/Eli Ben-Naim

Chart shows between March 11 and March 25 the daily cases of COVID-19 by county in New Mexico. Courtesy/Eli Ben-Naim
Chart shows the cumulative cases of COVID-19 by county in New Mexico. Courtesy/Eli Ben-Naim